Compared to What?
Every impressive number is quietly missing its bottom half. A three-question test for “97% token reduction” claims.
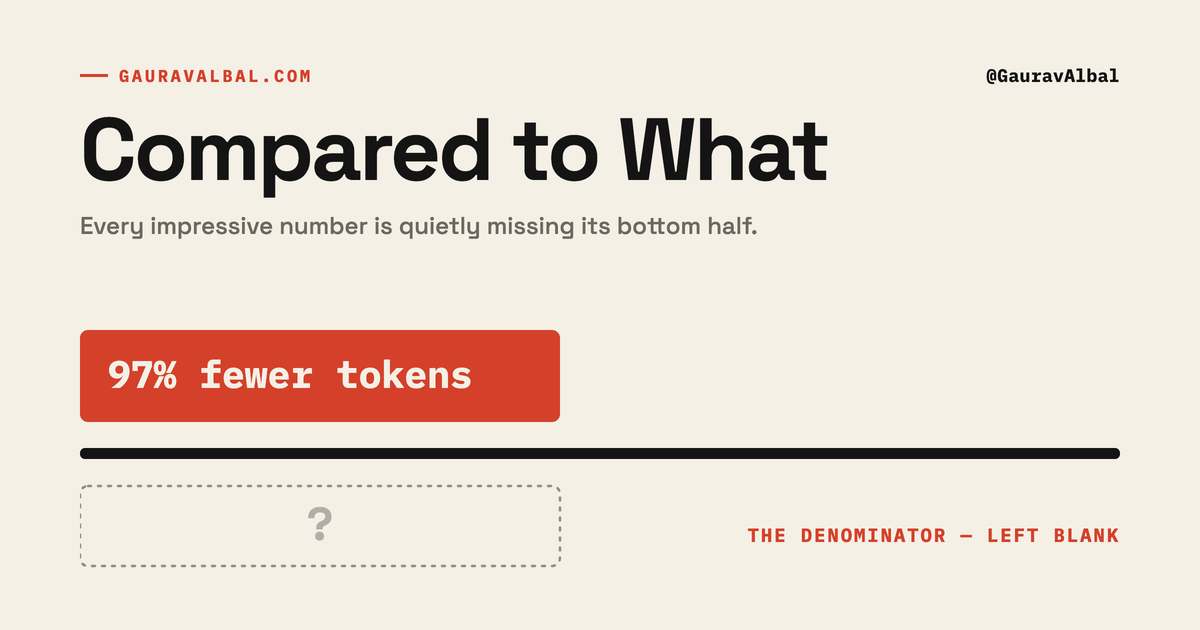
The jump starter box said it was "good for a car." One dead battery later I'm on the phone with AAA, because "good for a car" turned out to mean 500 amps against an engine that wanted 660. For some reason I'd trusted the box to know my needs better than I did.
I think about that box every time an X post shows me a random stat like "97% token reduction." I always look to see what the baseline was, and I so rarely find one.
You've seen these too — maybe you retweeted one this week; they're engineered to be retweeted. By the end of this there's a three-question test that makes numbers like that either mean something or evaporate. It fits in a reply, which is where I mostly use it.
What I'm really trying to say is that an entire category of AI tooling claims has been built without the load-bearing methodological step under it, and the missing step is the same one every baby DS makes. That omission is what makes the claims unfalsifiable, and unfalsifiable claims are the difference between shipping wins and shipping SEVs.
The omission is the counterfactual.
The load-bearing false belief: a random number is proof the thing is good for you. No different than the fancy new $200 vitamin Gwyneth Paltrow sang a lullaby over the phone to — it'll fix your liver and your posture and your life, and it never once has to beat not taking it. That's the whole trick. A percentage without a denominator is the same product: an orphaned numerator, priced by marketing.
You see X% reduction in tokens. You see Y% faster wall-clock. You see Z% improvement on some agent benchmark. The number is presented as evidence of value, like it'll make your ideas XYZ% better. The question that determines whether the number is evidence of anything at all is "Compared to What?", and in the pitches I read, that question is basically never answered.
A claim with no counterfactual is causally unidentified — in plain English, "we have no idea if A caused B" -- a cardinal sin of measurement. It is also, in the practical sense, the dominant pattern in AI tooling marketing right now IMO. We should talk about both.
I didn't get smarter after the jump starter, to be clear. I just started asking the question before the AAA embarrassment instead of after.
The grep test
Here's the problem with token reduction as a headline metric.
Grep uses zero tokens -- 100% reduction in burn. Wow, amaze.
grep -r "fn handle_request" consumes literally zero tokens. It's the lowest-possible-token-cost system for any agentic search problem. It is also, in most of the situations where AI search is being used, the wrong tool — because the job is to find the thing relevant to the task, even when you don't know the literal string up front. You usually start from a semantic "help fix my slop." If you already knew the symbol names, you wouldn't need search — you'd have typed them.
Grep proves the floor exists; it isn't the answer. Token reduction bottoms out at 0 tokens, and any vendor claiming X% reduction is sitting somewhere on a line between zero tokens and infinity tokens, and the question that decides whether the reduction is valuable is whether it preserved the outcome. The efficiency of the search in a vacuum — mOrE EfFiCiEnT! — is beside the point; what you care about is whether your slop got fixed more efficiently as a full system.
Nobody tells you that because why would they it's a pile of fine print for an audience who tends to have their eyes glaze over when specificity is in the room. Naturally, the pitch deck just says 97%.
The pattern, with receipts
Pick a vendor pitch and read it. MindStudio's MCP optimization techniques claim up to 98% token reduction on structured data. ProjectDiscovery's Neo agent documents 59% from prompt caching alone, climbing to over 90%. And there's a whole genre of "97% token reduction" write-ups and toolkits — meta-tool wrappers that hide a big tool schema behind a handful of entry points — that lead with 97% and, you'll note, never a denominator.
Each one of these is a number without a denominator.
In fairness, some of them disclose more than others. Some mention task type, some mention model version, some include a methodology footnote. But the headline — the thing the marketing team chose to lead with, the thing that goes in the tweet, the thing the reader remembers — is the percentage.
The percentage is the artifact. The counterfactual is the truth.
Why this happens
Token cost is vendor-controllable. Outcome quality isn't.
Within a defined performance envelope, a vendor can reliably engineer their system to use fewer tokens. Compress prompts. Cache prefixes. Prune context. Switch to a smaller model on cheap subtasks. The numerator is fully under their control. They can move the number from 50% to 60% by spending a week on the prompt cache strategy.
A vendor is structurally unable to engineer the user's outcome to improve. The outcome depends on whether the agent found the right file, made the right inference, abstained at the right time, didn't send the user on a wild goose chase. It's dependent on whether the user has taste, file hygiene, is a SOLID/DRY adherent, loves simplicity vs 25 abstractions in a trench coat, etc.
These are counterfactual-anchored properties. To claim improvement on them, the vendor has to specify what the user would have done without the tool, measure that, and compare. That's hard. The public materials above don't do it, and the honest ceiling is a rough proxy anyway.
So the dimension that's vendor-controllable becomes the dimension that's reported. The dimension that's actually meaningful becomes a footnote, if it's mentioned at all.
This is measuring under the streetlight: looking for the metric where the engineering is, while the value sits downstream in the dark. The value is in the analyst hour you didn't spend, in the wrong path you didn't go down, in the recommendation you didn't act on. The metric is upstream, where the engineer can move it.
Three search systems
Imagine three semantic search systems.
System one perfectly returns exactly the files relevant to the task and no more. Perfect precision and recall. It also costs the most tokens, because reading the relevant files is the work.
System two also perfectly returns the relevant files plus a few irrelevant ones. Lower precision. The agent reads through the irrelevant ones to evaluate them, then proceeds with the relevant ones. More tokens consumed. Same eventual outcome.
System three perfectly returns the relevant files plus a long tail of speculatively related ones — files that match on weak signal, that might be relevant, that the ranker couldn't be sure about. The agent has to read all of them to evaluate them. Many more tokens consumed. And critically, the agent gets distracted. It pursues hypotheses anchored in the speculative material. The outcome degrades.
Naively, "token cost" for all three systems is zero, but that's just "buy now pay later" math and those chickens are gonna come home to roost before your task is done. Token cost is highest where precision is mediocre and recall is aggressive. Token cost falls when you accept lower recall and better-targeted retrieval. Outcome quality follows the same curve, because both metrics are downstream of whether the search wasted the model's attention.
The cheapest search is also frequently the best search.
A worse search system, judged on standard IR-precision metrics, can produce fewer tokens per task in an agentic loop and yet produce better task outcomes. The two metrics — vendor-controlled token cost and operator-controlled outcome — actively pull in opposite directions.
If you take token cost as your headline metric, you will eventually optimize against the outcome you're supposed to be improving.
What you actually care about
Here are the metrics that are counterfactual-anchored for an agent system. They're the ones that survive contact with the counterfactual.
Wrong-file-open rate. For agents that read code or data, the rate at which the first read is the right file for the task. Token cost can fall 90% while wrong-file-open rate stays unchanged. Token reduction without solve rate is decoration.
Operator-cost rate. Would a real person have wasted time on a claim the underlying data doesn't support? This is the metric that matters for any agent that produces work humans will act on, because the expensive failure is the confident one: the agent says something convincing enough that the operator acts on it before checking. Picture the memo: "attribution dropped 14% after Tuesday's pixel change — roll it back." Specific, confident, wrong — and the rollback is booked before anyone opens the data.
Time-to-verified-result: the clock runs until the work survives a real check, not until the model says it's done. You don't take your chicken out of the oven and slap it on your plate just because the oven says "time's up" do you? If you're a sane person you temp it first so as to avoid having Salvadore Monella as your secret dinner guest. The systems I keep running into never verify — they just hand the operator a confident wrong answer.
Hours-not-spent-on-an-unsupported-recommendation. The cost the vendor metric never captures. The actual unit operators care about. This is what the analyst hour buys when you replace it. This is what the analyst hour costs you when you don't.
Sixteen to zero. That's the score when I run this test against Arquebus — the agentic analytics harness I'm building — on the failure that actually costs money: the confident wrong memo a real person would have acted on. Across 62 adversarial cases in two independently designed corpora — 32 on root-cause analytics, 30 on tracking reconciliation — raw Sonnet 4.6 produced sixteen of them; the harness produced zero. Same cases, same rubric, independent scorers, no shared cases between corpora. (For the falsification-minded: the paired exact sign-tests land between p ≈ 0.001 and p ≈ 0.004.) This is a test I try to run continuously — and one I make my agents run too; more on that machinery in a future post if people are interested. The headline from both readouts: raw Sonnet is the better prose writer; the harness is the better operator guardrail.
What matters is less the rubric I happened to use than its shape: the rubric was specified, the comparison was paired, the methodology disclosed.
The only number worth trusting is one you could have proven wrong.
The Compared-to-What test
The next time a vendor shows you an AI tooling metric, run the Compared-to-What test. Three questions. All three are questions I could have asked the jump-starter box. (My new one is sized off the measured requirement with a 50% safety margin, if you're curious.)
Compared to what? If the answer is "compared to not using the tool," fine — what does "not using the tool" mean? Compared to grep? Compared to a junior analyst? Compared to the manual workflow you had two years ago? Specify.
Measured on what task distribution? Adversarial cases? Happy-path cases? The vendor's curated demo set? The distribution determines whether the result generalizes. A 97% reduction on the vendor's chosen task distribution is a 97% reduction on the vendor's chosen task distribution. It is not a 97% reduction on yours.
With what outcome metric? If the only number is token count, the vendor is measuring under the streetlight. If the number includes operator-cost, wrong-file-open rate, time-to-verified-result, or any other counterfactual-anchored quantity, engage. The vendor that publishes the harder number is the one to trust.
And it isn't just for vendor pitches. Your next metric — win or loss — check it more deeply. Think about the second-order consequences, and about what you're really measuring for your task, not just the thing you happened to have instrumented.
What good looks like
Augment did the boring thing correctly. They ran their agent Auggie against Claude Code on the same model — Opus 4.7 on both sides — and put the pass rate right next to the cost: 67.4% vs 66.3% on Terminal Bench 2.0, 61.8% vs 59.9% on SWE-Bench Pro, at 33% and 23% less spend. They named the benchmark, ran five attempts per task, and were honest about the noise: the 1.1% quality gap sits inside run-to-run variance, the cost gap doesn't. On their own private repos they called quality a wash — 61 tasks passed to Claude Code's 62 — and still reported $3.90 per passing task against $6.49. Same-model baseline, named task distribution, cost per passing task. That is the receipt. Hold everyone else to it.
This is the only bar there is — the one every other measurement-driven discipline already uses. AI tooling has been allowed to operate below it because the field is young, not because the bar is out of reach.
"Good for a car" and "97% token reduction" are the same sentence in a different font. I already paid for the first one; the second one invoices you later.
More receipts like this land on gauravalbal.com — subscribe there for more.